
More than 3,000 homes had their asking prices cut every day: is the UK property market crashing?
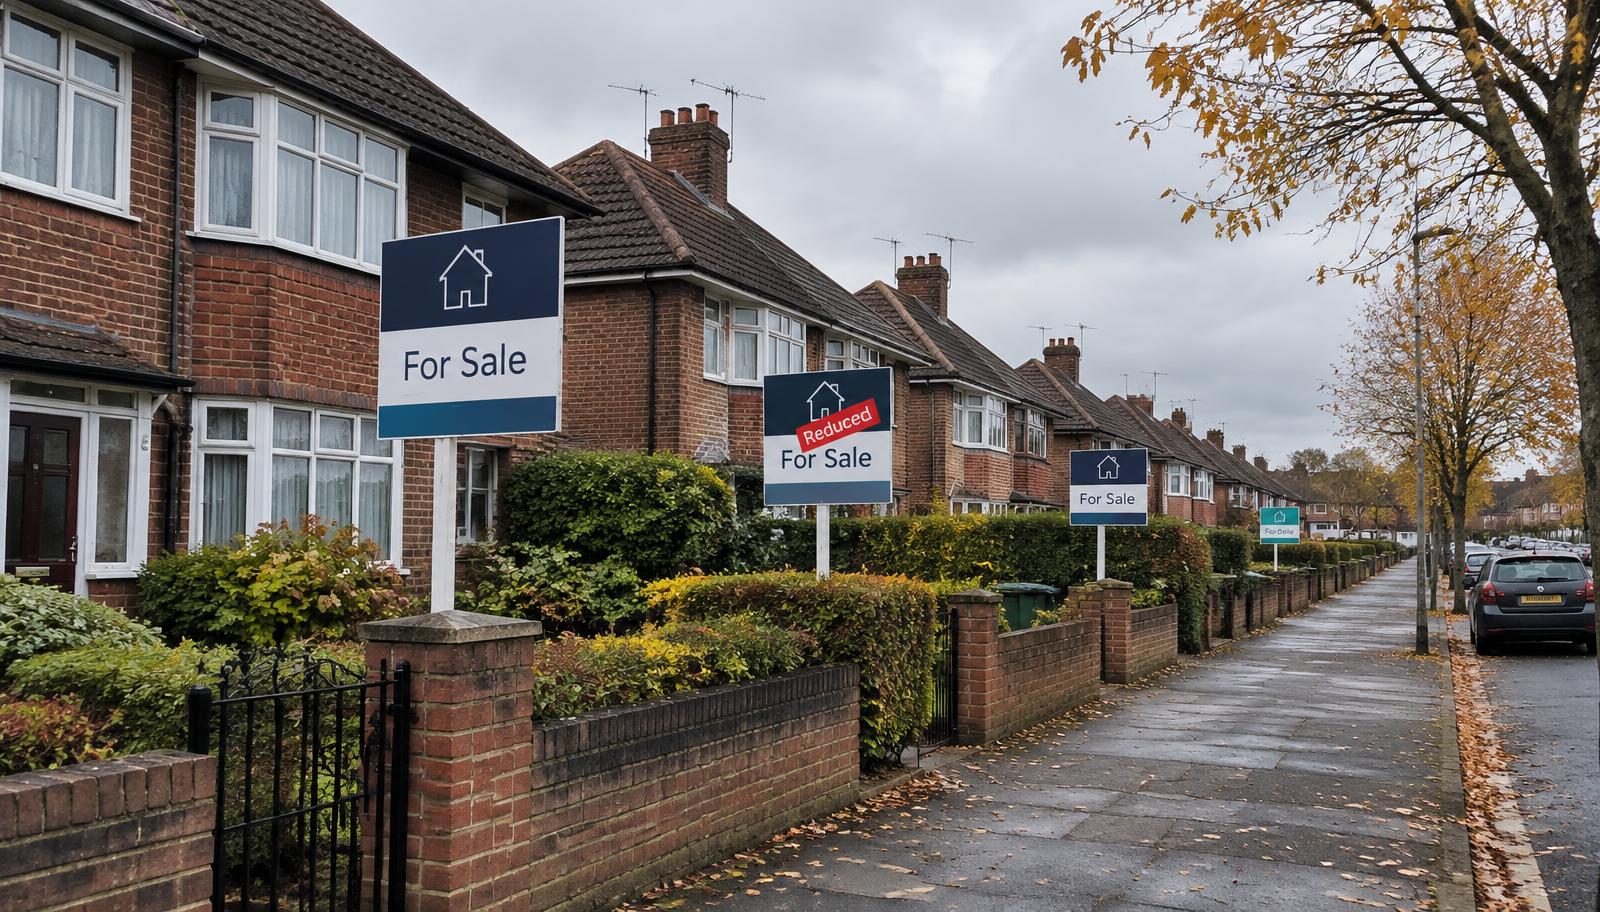
No, the UK property market is not crashing, but it is clearly slowing. More than 3,000 homes a day had their asking price cut in September 2026, the highest monthly figure Rightmove has recorded in 15 years, while annual house price growth has slowed to just 0.5%. That points to a buyers' market in many areas, not a collapse.
If you are house hunting, or thinking of selling, the headlines can feel alarming. A record number of price reductions sounds dramatic. But asking-price cuts and falling house prices are not the same thing, and the national picture hides big differences between streets. Here is what the 2026 data actually shows, with real examples, and how to check what is happening to prices on the streets you care about.
What do the 2026 numbers actually say?
Two sets of figures matter here, and they measure different things.
The first is asking prices. According to Rightmove, more than 3,000 property listings a day had their asking price reduced during September 2026, the highest figure for any month since September 2011. The average reduction was nearly 7%, equivalent to almost £21,000 on a typically valued home. Rightmove also found that homes which sell without needing a reduction find a buyer in 39 days on average, compared with 119 days for homes that have to cut their price. The BBC's report on the same figures put it down to a glut of homes on the market and some sellers starting with unrealistic expectations.
The second is sold prices. The Nationwide House Price Index for October 2026 shows annual growth of 0.5%, the slowest pace since January 2024, with prices unchanged month on month and the average UK property at £273,566. Growth is barely moving, but it is still growth. Earlier in the year, research by Benham and Reeves found that around 37% of homes listed for sale in England had already taken a price cut.
- Over 3,000 asking-price reductions a day in September 2026 (Rightmove), a 15-year high.
- Average reduction of nearly 7%, around £21,000 off a typical home.
- Annual house price growth of 0.5% in October 2026 (Nationwide), the slowest since January 2024.
- Homes priced right from the start find a buyer in 39 days, against 119 days for homes that cut their price.
Five real asking-price reductions
National percentages only tell you so much. These are real, individually reported examples from across England and Wales. Listings change and are removed, so the figures below are as they stood at the dates shown.
The Old Rectory, Marston Moretaine, Bedfordshire: £2.25m to £1.8m
The seven-bedroom Grade II-listed former home of Captain Sir Tom Moore was put up for sale in 2024 at £2.25 million. In October 2026 the asking price was cut by £450,000 to £1.8 million, a 20% reduction after roughly two years on the market, as reported by The Independent. Unusual homes with a story attached are hard to price, and this one shows how long a property can sit when the opening price misses the mark.
Roath Park, Cardiff: £1,150,000 to £1,095,000
A six-bedroom home overlooking Roath Park, owned by actress Ruth Jones, was first listed in August 2025 at £1,150,000 and reduced by £55,000, a cut of just under 5%, according to the Barry and District News. Even distinctive, well-located homes in sought-after parts of Cardiff have not been immune to reductions.
Barnsole Road, Gillingham, Kent: £200,000 to £175,000
A three-bedroom terraced house in need of renovation, listed for auction, came to the market at £200,000 and was reduced to £175,000 in November 2026, a cut of 12.5%. Doer-uppers have been some of the hardest homes to shift this year, because buyers are factoring in the cost of works alongside higher mortgage rates.
Simpson Road, Snodland, Kent: £270,000 to £220,000
Another three-bedroom terrace, this time in Snodland and sold by modern auction, started at £270,000 in early September 2026, dropped to £250,000 and then to £220,000 by mid-October. That is a total reduction of 18.5% in around six weeks, and a good example of a seller chasing the market downwards rather than pricing correctly at the start.
Knavesacre Court, Parkwood, Kent: £270,000 to £230,000
A one-bedroom bungalow in Parkwood, near Rainham, was listed at £270,000 in mid-September 2026 and cut twice within a fortnight, first to £250,000 and then to £230,000, a 14.8% reduction. Smaller homes aimed at first-time buyers and downsizers are feeling the effect of higher borrowing costs most directly.
A price cut is not the same as selling for less
This is the distinction most headlines blur. An asking price is what a seller hopes to get. A sold price is what a buyer actually paid, recorded at HM Land Registry. When Rightmove reports 3,000 reductions a day, it means sellers are lowering their expectations, not necessarily that homes are selling for less than they were previously worth.
Plenty of the homes being reduced in 2026 were simply overpriced to begin with. A seller who lists at £350,000, cuts to £325,000 and sells at £320,000 has not lost money if the home was realistically worth £320,000 all along. The reduction is a correction of the asking price, not a fall in the value of the house. Our guide to asking prices and sold prices goes into this in more detail.
What matters more is the smaller number of homes selling for less than their owner previously paid. That does happen, and it is a different measure from asking-price cuts. These two real sale histories, looked up in PicAHome, show what it looks like when it does.
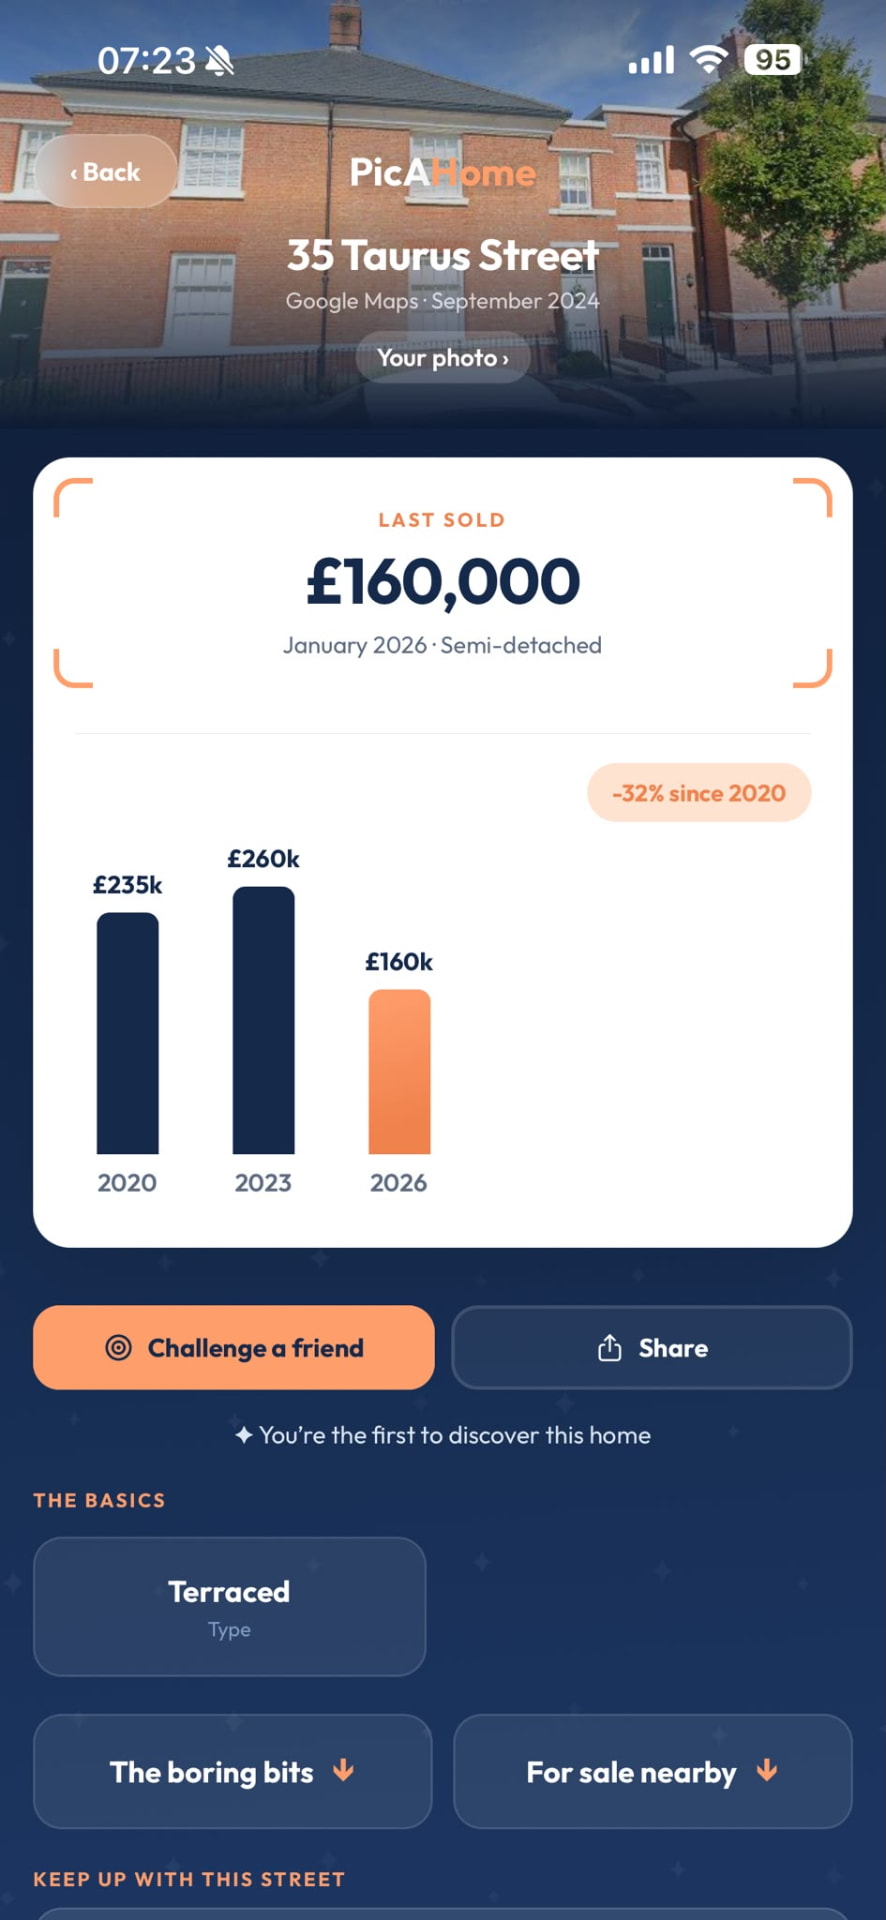
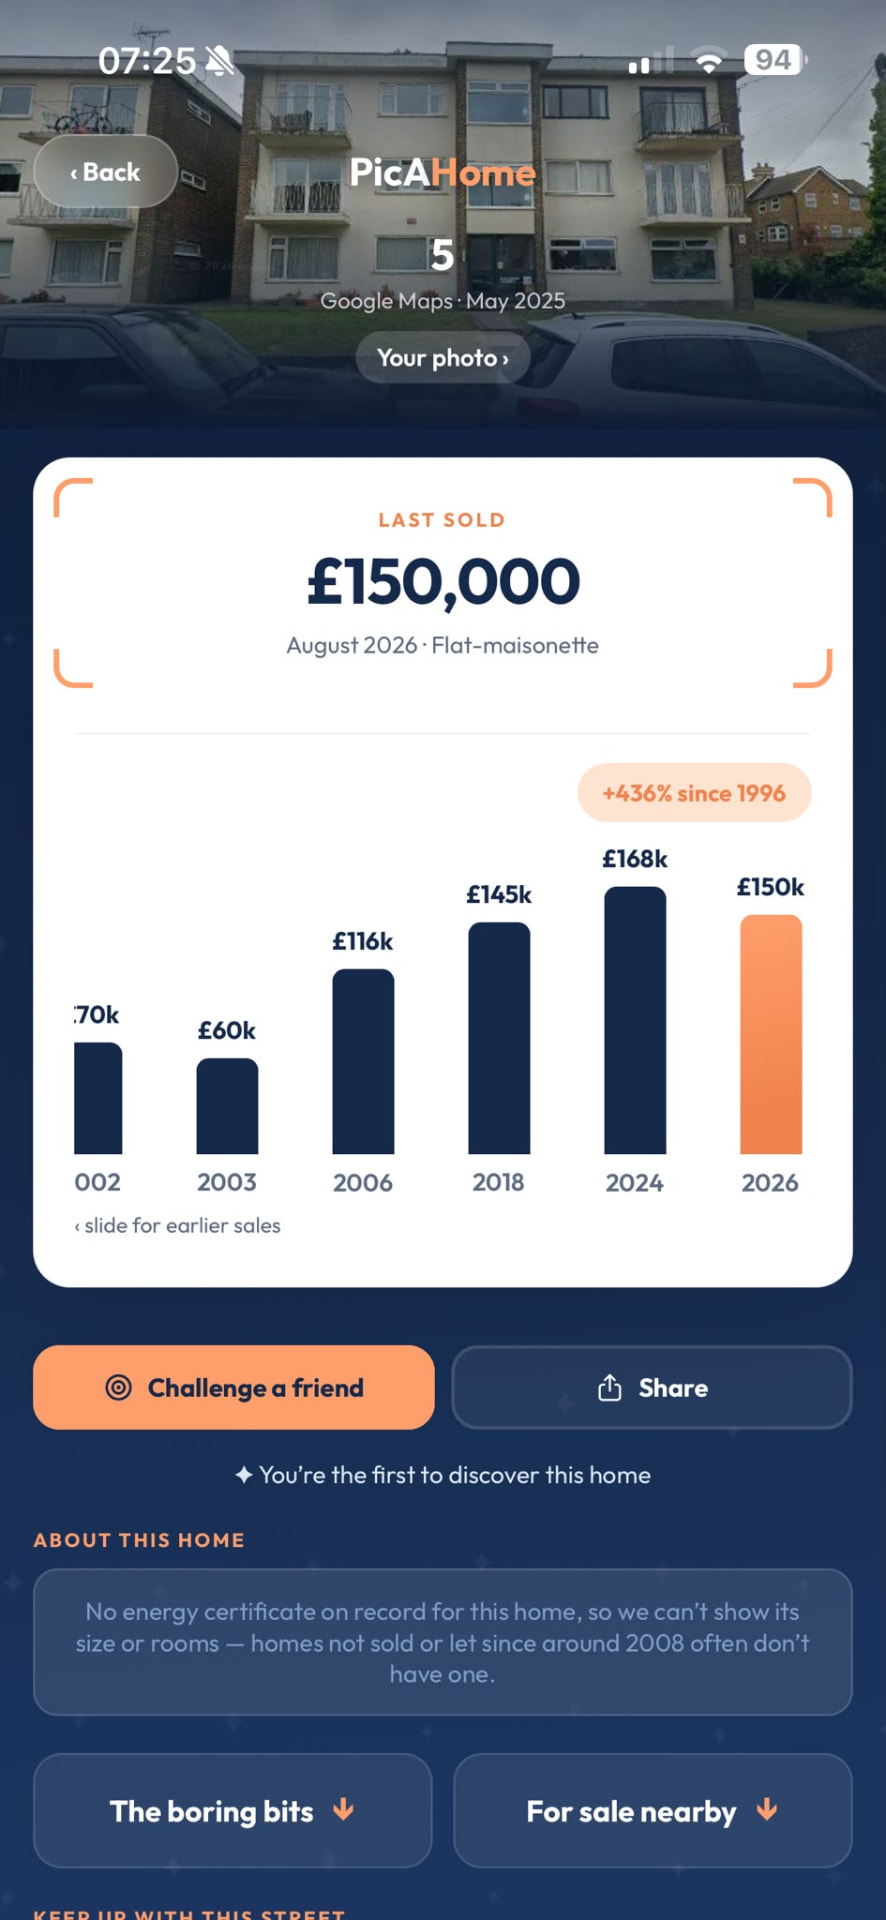
Falls like these are real, but they are still the exception rather than the rule, and a sold-price record on its own does not tell you why. Condition, a short lease, a quick sale or a change to the property can all sit behind a lower figure. That is why it is worth looking at the whole history of a home and its neighbours before drawing conclusions, rather than reading one sale as a verdict on the market.
So is it a crash, or something more complicated?
A crash would mean sold prices falling sharply across most of the country at the same time. The evidence for that in late 2026 is weak. Nationwide's index shows prices broadly flat rather than falling, employment and real incomes have held up, and household debt levels remain low by historical standards.
What the reduction figures do show is a market that has tilted towards buyers. There are more homes for sale than there have been for years, mortgage rates have risen, and sellers who tested the market with optimistic prices are being forced to adjust. That adjustment is happening unevenly. Some streets and property types, like renovation projects and homes aimed at first-time buyers, are seeing repeated cuts. Others, particularly well-presented family homes in short supply, are still selling quickly and close to the asking price. It is a localised slowdown with pockets of real weakness, not a national collapse.
Why one street's history beats a national average
National indexes blend millions of sales into a single number. Useful for economists, less useful when you are deciding whether to offer on a specific house. A 0.5% national growth figure can sit alongside a street where three homes have cut their prices twice, and another street two miles away where everything sells within a month.
The more useful questions are about the individual property and its neighbours. What did this house last sell for, and when? What have similar homes on the same street sold for recently? Has this listing already been reduced, and how long has it been on the market? Are there planning applications nearby that might affect it?
That is exactly the kind of checking PicAHome was built for. When you are out viewing or walking a street, you can stand outside a property, take a photo there and then, and the app uses your location and the image to identify the home and pull together its sold-price history, EPC rating and local planning applications where available. A photo taken earlier will not work, because the app needs your live location to know which house you are looking at. From home, the postcode search lets you do the same research remotely: enter a postcode and browse the homes, sold prices and listings for that area. Our guides to checking house prices on your street and a property's sale history explain how to read what you find.
None of this replaces a survey or your own judgement, and no app can tell you what a home will be worth next year. But walking into a negotiation knowing what the house and its neighbours actually sold for puts you in a far stronger position than relying on a national headline.
PicAHome is completely free to download and use. No subscription, no payment, no card required.
Frequently asked questions
Are house prices falling in 2026?
Is the UK property market crashing?
How can I check if house prices are falling near me?
How do I check previous house sale prices?
Are house prices dropping in Kent?
Are UK house prices going to crash?
Seen a home you're curious about?
Point. Discover. Know.
Download PicAHome and start discovering the properties around you. Free, with unlimited Discoveries on a free account.
Scan to download PicAHome and start discovering.
Keep reading
App update: explore properties with just a postcode
Our latest update lets you explore homes by postcode and follow new listings, price changes and planning decisions. No exact address needed, and completely free.
Read articleThe reason we built the PicAHome app
Why I believe house hunters deserve a fuller picture of a property, and why we wanted to make that information easier to find.
Read articleHow to get alerts when a house comes up for sale
Portal alerts, local agents and street notifications each catch different opportunities. Here's how to set them up without getting buried in listings.
Read article